We usually adapt a genomic foundation model by training it: collect labels, define a loss, and let an optimizer adjust the weights. What happens if an LLM writes the changes itself?
In this experiment, Claude Opus 5.5 edited the tensors of DNABERT-2-117M directly—its embeddings, attention, MLPs, and LayerNorms. No gradient descent or optimizer updated the edited models. The resulting checkpoints were evaluated as ordinary HuggingFace models on genomic classification tasks.
The inspiration comes from Sparks of Weight-Space Programming, by Rikiya Takehi, Jayden Teoh, Alex Zhang, and Omar Khattab. Their work explores LLMs reading and writing neural weights directly, including targeted changes to a language model. Here, we ask a related question in genomics: can explicit biological rules and features already inside a DNA model be turned into working circuits?
This is a preliminary result from one run per arm. The strongest method uses labels and measured activations; it is gradient-free adaptation, not learning without data. Full fine-tuning remains substantially stronger.
A small signal path through a large network
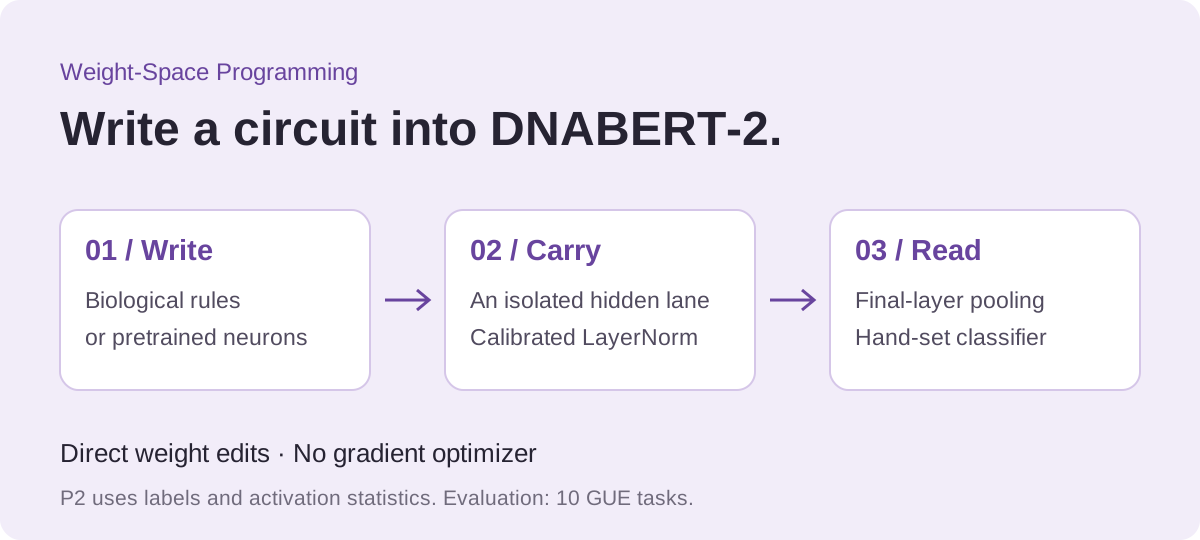
DNABERT-2 has 12 transformer layers and a hidden width of 768. The central construction reserves one hidden dimension as a dedicated signal path through the network.
- Choose a lane. Measure the effect of removing candidate dimensions on synthetic random DNA, then select a dimension that causes relatively little disruption.
- Isolate it. Zero the weights that would otherwise read from or write into that dimension.
- Write a useful signal. Put a biological score in token embeddings, or route selected pretrained MLP neuron activations into the lane.
- Calibrate LayerNorm. Set gains and biases so the signal survives the repeated normalization operations.
- Collect and classify. Rewire a final-layer attention head to average the signal into [CLS], then hand-set a pooler and classifier to read it.
For the reported EMP_H4 P2 checkpoint, this changes 348,172 of approximately 116.5 million encoder weights—0.30%. That count excludes the roughly 590,000 pooler and classifier values, which are written from scratch because those components are absent from the stock checkpoint.
Two sources of instructions: biology and existing neurons
P1 and P1b start with biological rules. For yeast histone occupancy, the proposed score rewards GC content and penalizes A/T runs. For promoter and transcription-factor tasks, the rules use GC or CpG content. These are task-dependent heuristics, not universal descriptions of regulation.
Neither arm runs the model on task sequences during editing. Their scales and thresholds still use statistics of training-sequence strings, and synthetic DNA is used for calibration. “Zero task forward passes” therefore does not mean “no access to task data.” P1 reads out early; P1b moves the readout to the last layer.
P2 reuses features DNABERT-2 has already learned. It measures MLP activations on seven batches of 512 sequences. For each neuron, it compares the class means relative to the activation standard deviation.
Selected neurons receive a signed inverse-standard-deviation weight into the lane. The decision threshold is placed between the class means, and the number of neurons is chosen on a held-out batch. The binary construction resembles a nearest-mean classifier compiled into the network. The splice task uses a separate multiclass variant.
Every parameter is frozen for automatic differentiation, model calls run in inference mode, and task forward passes are logged. The test split is withheld during editing and scored once. P2 uses supervised statistics and validation-based selection, even though no gradient optimizer is involved.
What the experiments show
The evaluation covers 10 of GUE’s 28 tasks: yeast histone occupancy, human promoters, human transcription-factor binding, and splice classification. Scores below are MCC × 100, not accuracy percentages.
| Task | Stock | P2 edit | Same-data probe | Full-data probe | Published fine-tuning |
|---|---|---|---|---|---|
| EMP_H3 | −5.3 | 58.2 | 58.4 | 66.6 | 78.3 |
| EMP_H4 | −15.2 | 72.3 | 64.1 | 73.3 | 80.7 |
| prom_core_tata | −2.0 | 39.4 | 42.9 | 46.8 | 74.2 |
| prom_core_all | 3.4 | 46.6 | 46.4 | 57.3 | 69.4 |
| prom_300_tata | −1.5 | 26.7 | 36.7 | 40.3 | 71.6 |
| prom_300_all | 3.5 | 71.7 | 65.6 | 78.4 | 86.8 |
| tf_0 | 2.5 | 54.5 | 47.5 | 62.9 | 72.0 |
| tf_1 | 3.1 | 64.3 | 52.5 | 68.4 | 76.1 |
| tf_4 | 0.2 | 53.5 | 53.3 | 62.7 | 77.4 |
| splice | −4.1 | 18.2 | 17.5 | 24.8 | 85.0 |
| Mean | −1.5 | 50.5 | 48.5 | 58.2 | 77.1 |
The stock baseline uses a random task head, so its near-chance score is not evidence that pretrained DNABERT-2 lacks useful representations. The probes demonstrate that those representations already contain substantial task information.
P2’s average is 2.0 MCC points above the same-data probe. Some differences are large: on EMP_H4 it scores 72.3 versus 64.1, and on tf_1 it scores 64.3 versus 52.5. Others favor the probe: on the 300-bp TATA promoter task, P2 scores 26.7 versus 36.7.
The full-data probe averages 58.2. Published full fine-tuning results average 77.1 for these tasks, according to the comparison collected in the experiment README. Those published numbers are a reference rather than a newly reproduced, matched-compute experiment.
P1 and P1b average 29.1 and 28.5 across the nine binary tasks. Their averages should not be compared as though they cover the same task set as the ten-task P2 result.
A successful classifier can still damage its host
Classification performance is only half the question. After editing the model, can it still predict masked DNA tokens?
The first construction, P1, exposed a serious failure. Reading the signal into [CLS] at the first block required normalization settings calibrated for that token. But [CLS] had a much larger activation scale than ordinary tokens. Applying those settings through later blocks amplified the lane and damaged masked-token prediction.
P1b and P2 defer readout to the last block. On the nine checked tasks, their masked-token losses are slightly lower than the stock model’s. On EMP_H4, for example, the losses are 6.42 for stock, 9.48 for P1, 6.36 for P1b, and 6.39 for P2.
This supports preservation on the measured masked-token check, not a claim that every original capability survives. The check uses 1,024 test sequences per task with 15% masking; stock masked-token accuracy on these short sequences is itself only 3–8%.
What failed taught us how to write the circuit
- Small weights do not identify an unimportant dimension. Measured ablation on synthetic DNA was more useful than choosing a lane from weight norms alone.
- Center the signal at its decision boundary. Carrying “score minus threshold” together reduces sensitivity to positive rescaling by LayerNorm, although normalization still needs calibration.
- Account for [CLS]. Its measured input scale was about 31, versus about 0.4 for ordinary tokens. Ignoring that difference could destroy the intended signal.
- Signal strength matters. Very small lane values were overwhelmed by normalization effects; one P2 attempt collapsed to MCC 0.
On synthetic DNA, P1’s decisions agree with the intended Python rule 96–100% of the time; P1b agrees 92–97%. This provides a direct check of whether the edited network computes the proposed rule, while also showing that the implementation is not exact.
What this experiment does—and does not—establish
The most interesting result is that a useful computation can be deliberately installed inside a pretrained genomic model. In the stronger arm, it reads existing learned features through an explicitly constructed path and turns them into task predictions.
There are substantial limits. Only 10 tasks were tested, with one seed and one run per arm and no error bars. P2 uses labeled data. The new classifier adds hand-written parameters. The published fine-tuning baseline is much stronger, and simple sequence-wide pooling performs poorly on splice classification, where position-specific signals matter.
The next experiments should test more tasks and seeds, compare matched data and compute budgets, and ask whether position-aware circuits can address the current weaknesses. Broader preservation tests are also needed before treating an edited model as a general-purpose replacement for its original checkpoint.
Experiment details and results are reported in the supplied “Weight-Space Programming of DNABERT-2” project README. This article summarizes those results; it does not independently reproduce the runs. Conceptual illustration created for this post. Original inspiration: Takehi, Teoh, Zhang, and Khattab, “Sparks of Weight-Space Programming” (November 2, 2026).